

nfl positional value: cap spending by position from 2003 to 2017
Aug 20, 2018 · 6 minute readTLDR: Teams are devoting more spending resources to positions heavily involved in the passing game - quarterbacks, wide receivers, tight ends, defensive backs. On the contrary, and as expected, teams are spending far less on running backs.
We’ve all heard the story that the NFL is becoming a passing league. And most would agree that running backs in particular, have seen their value go down in recent years.
One way to measure positional value is to measure how much of its cap space a team is willing to devote to each position - aka how much ‘cap market share’ a position takes. In this post, I share cap spending breakdowns by position over the years.
Data
Spotrac provides cap space information from 2011 to current. USA Today used to maintain an online database of cap information going back to 2000, but has since taken access to the database down. I used Way Back Machine to find archived pages from the site; the earliest year I could find data for all teams was 2003.
A Jupyter Notebook containing my code for scraping and processing the data can be found here.
Comparing 2003 and 2017
Below are the cap market share breakdowns by position from 2003 and 2017:
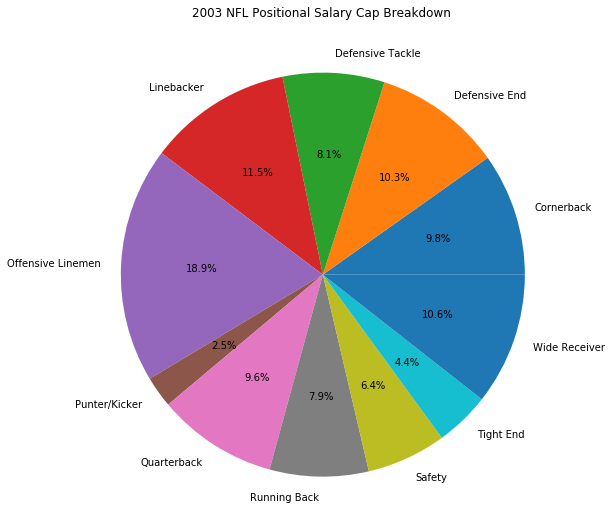
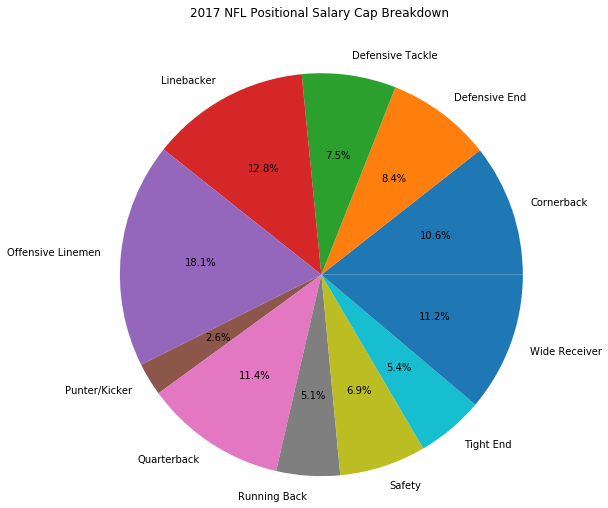
The percentage split, for the most part, appears similar between the two years. However, note that with so many positions, and relative limited flexibility in how many players can be rostered at each position (i.e. you’re always going to need 2+ quarterbacks, 3+ running backs, 7+ offensive linemen, etc.), even what seem to be ‘small’ changes in spending can in fact represent fairly large changes in positional value.
Consider, for instance, the NBA, a league with just five positions (traditionally speaking - forget the ‘positionless’ talk for now). Suppose teams spend 24% of their market cap on point guards. If teams increase spending on point guards by 25%, 30% of the cap becomes devoted to point guards, a noticeable difference. Now consider the NFL, with over 15 positions: if teams spend 5% of their market cap on running backs, and also increase spending by 25%, the running back market share would ‘only’ increase to 6.25% - which doesn’t seem as big, even though the shift in positional value might be similar in both cases.
Therefore - my point is: don’t be mislead by seemingly “small” changes in positional market share - instead it might be more meaningful to look at percentage change in market share for each position (i.e increasing market share from 5% to 6.25% represents a 25% increase in market share for running backs).
Two of the biggest changes in positional spending between 2003 and 2017 are at quarterback and running back, corroborating the idea that more than ever before, today’s NFL is a passing league.
To get a sense of this change, if teams valued running backs in 2018 as they did in 2003, 49ers Running Back Jerick McKinnon’s 4 year, 30 million dollar contract signed in June 2018 turns into a whopping 4 year, 46.5 million dollar contract (assuming teams tend to roster the same number of running backs in both years).
Beyond quarterback and running back, we have:
- Positions Increasing in Cap Share: Quarterback, Linebacker, Cornerback, Wide Receiver, Tight End, Safety, Punter / Kicker
- Positions Decreasing in Cap Share: Running Back, Offensive Linemen, Defensive Tackle, Defensive End
The main surprise to me is that defensive ends have lost value, during a time when pass rush is perhaps becoming more valuable than ever. One potential explanation is the rise of 3-4 defenses; teams are rostering more linebackers and less defensive lineman, and so the spending follows.
Ultimately, this comparison between 2003 and 2017 cap utilization has some inherent limitations. First, rookie spending decreased significantly due to new rules in 2011 - so rookie contracts take up a smaller amount of cap market share in 2017. This can become a slight problem - for instance, suppose there is no difference in positional valuations between 2003 and 2017. Also, suppose teams tend to draft a lot of offensive linemen in general. Then, you might see offensive linemen taking up a smaller percentage of cap market share in 2017 than in 2003 (because the rookie contracts are cheaper), when in reality positional value hasn’t changed over time.
Second, the USA Today data (2003 data) shows the cap hits only of the rostered players (52), while Spotrac (2017 data) includes things like dead cap (cap hits of players who are on longer on the team - i.e. guaranteed money of a cut player) - ideally, we would prefer an apples-to-apples comparison.
Comparing 2011 and 2017
Spotrac contains contract data going back to 2011; therefore if we want to make an apples-to-apples comparison with 2017, the best (earliest) we can do is to compare it to 2011.
Spotrac’s position labels are also much more descriptive, giving us more meaningful positions to work with:
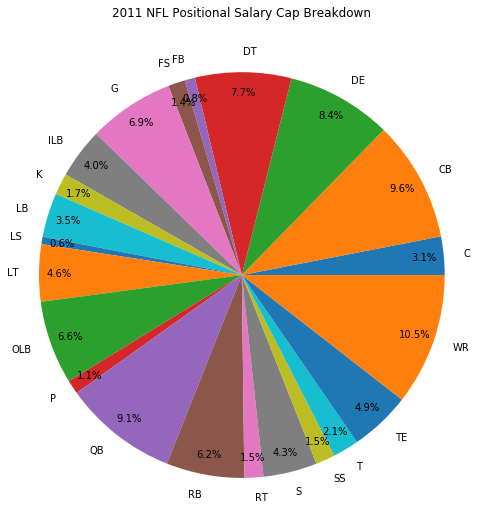
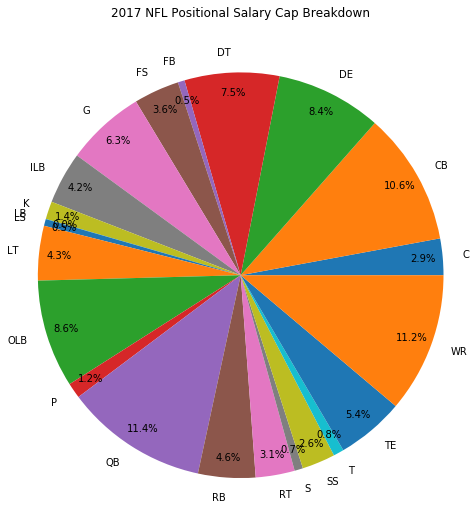
Quarterback and running back are again two positions of note, and we can see many of the same trends as before:
- Positions Increasing in Cap Share: Quarterback, Punter, Outside Linebacker, Inside Linebacker, Free Safety, Cornerback, Wide Receiver, Tight End, Strong Safety, Right tackles
- Positions Decreasing in Cap Share: Running Back, Left Tackle, Long Snapper, Linebacker, Kicker, Guard, Fullback, Defensive Tackle, Center, Tackle, Safety
- Positions Staying the Same in Cap Share: Defensive End
We also see things like spending drastically increasing on right tackles, free safeties, and outside linebackers - though this is accompanied by drastic decreases in spending on the ‘Tackle’, ‘Safety’, and ‘Linebacker’ positions, so it is unclear if spending on these positions are actually on the rise or Spotrac is just getting more precise with its labeling. Note, however, spending is down by a sizable amount on linebackers as a whole (combining ILB, LB, and OLB), decreasing from 14.1% to 12.8%.
I personally was surprised to see spending on guards and centers is dropping - for whatever reason, I have been under the impression that interior offensive linemen have been becoming more valuable - perhaps due to the drafting of interior offensive linemen like Brandon Scherff, Jonathan Cooper, Chance Warmack, and Quentin Nelson in the top 10. It’s also curious to me that linebacker spending is dropping (when players like Von Miller are classified as OLB on Spotrac); perhaps this is due to the league transitioning to a ‘nickel league’ where teams play in nickel defense more often than base defense, thus resulting in less linebackers on the roster.
Summary
The main takeaway here is that spending on positions that are heavily involved in the passing game is increasing - quarterbacks, wide receivers, tight ends, defensive backs. Meanwhile, as predicted, running back value has shot down by a large margin.
That’s no surprise - but it is always nice to see data backing up our hunches.